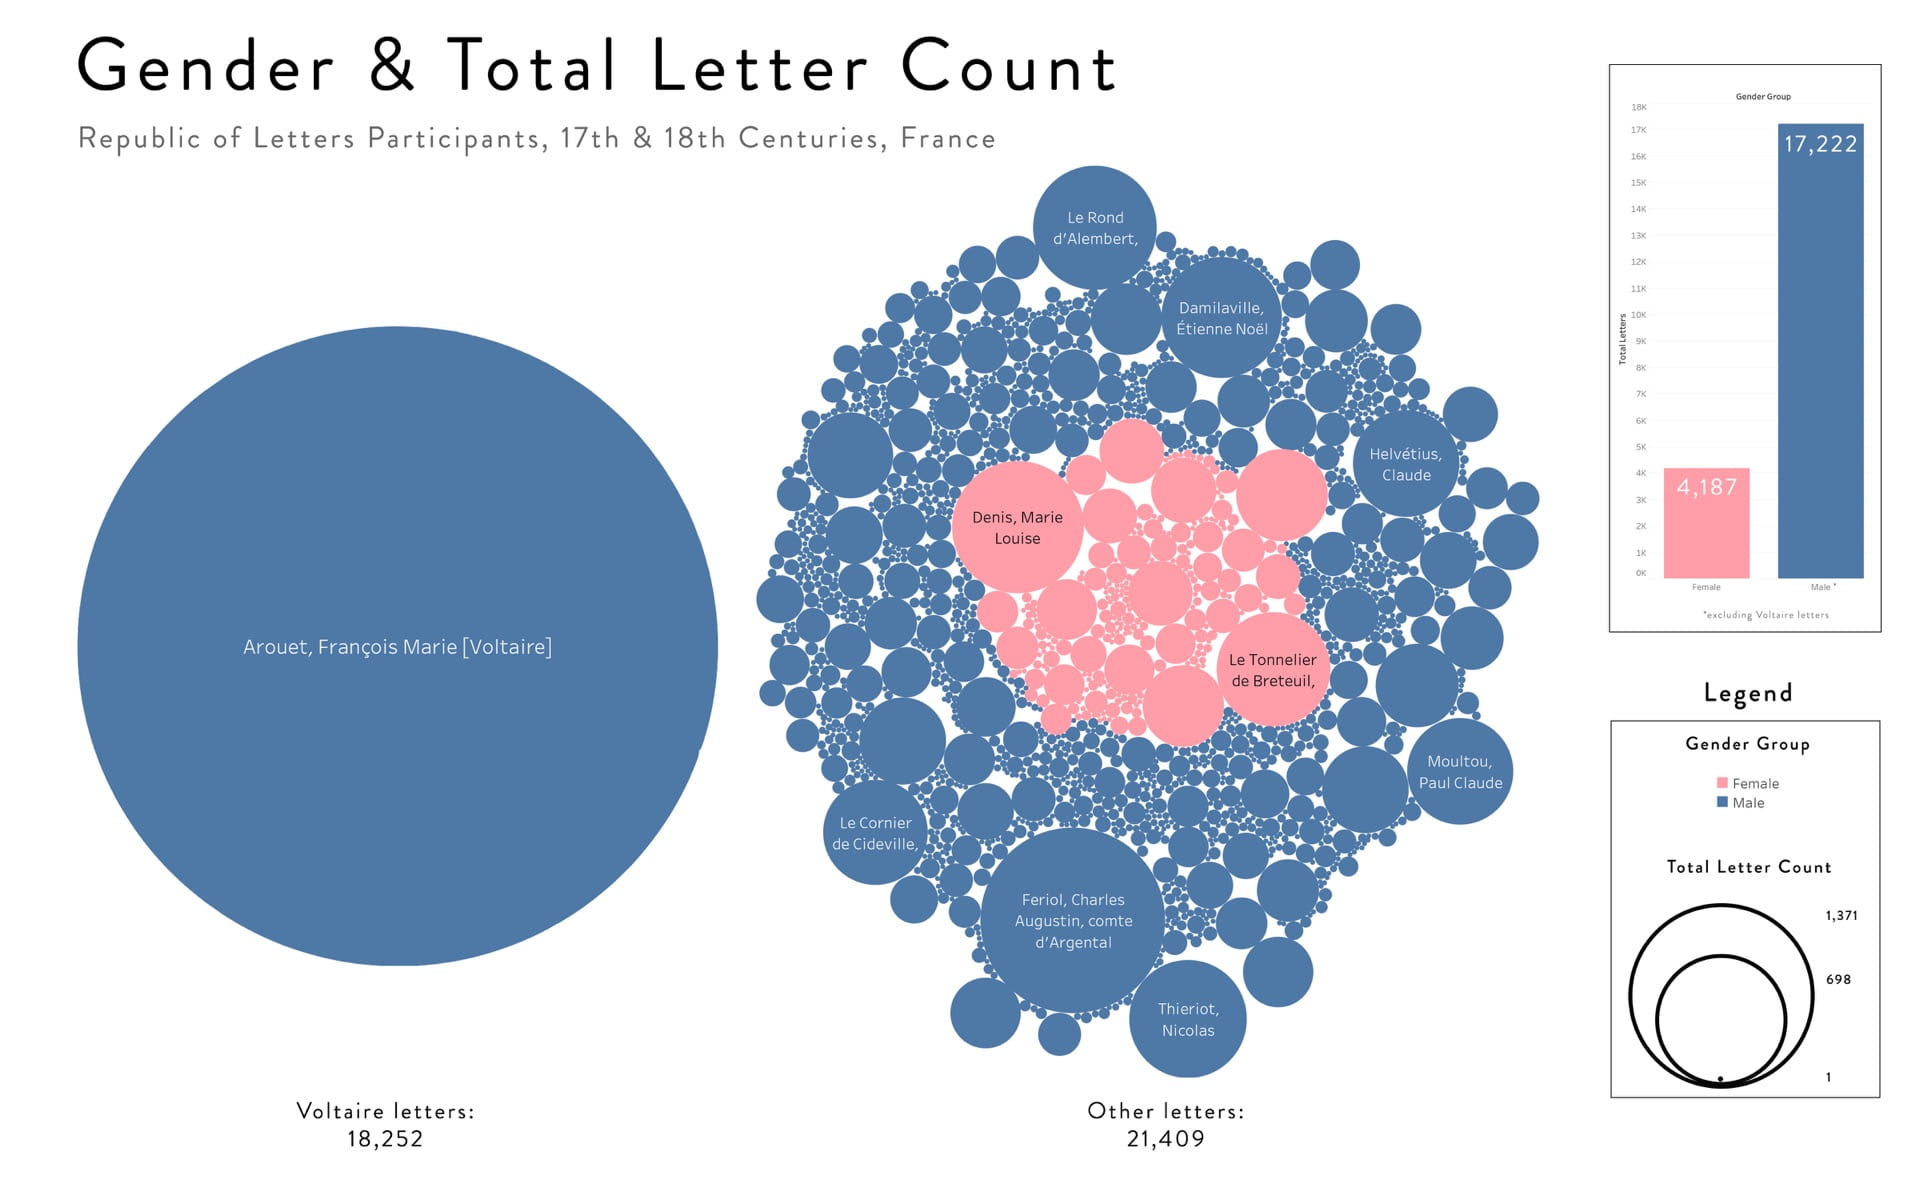
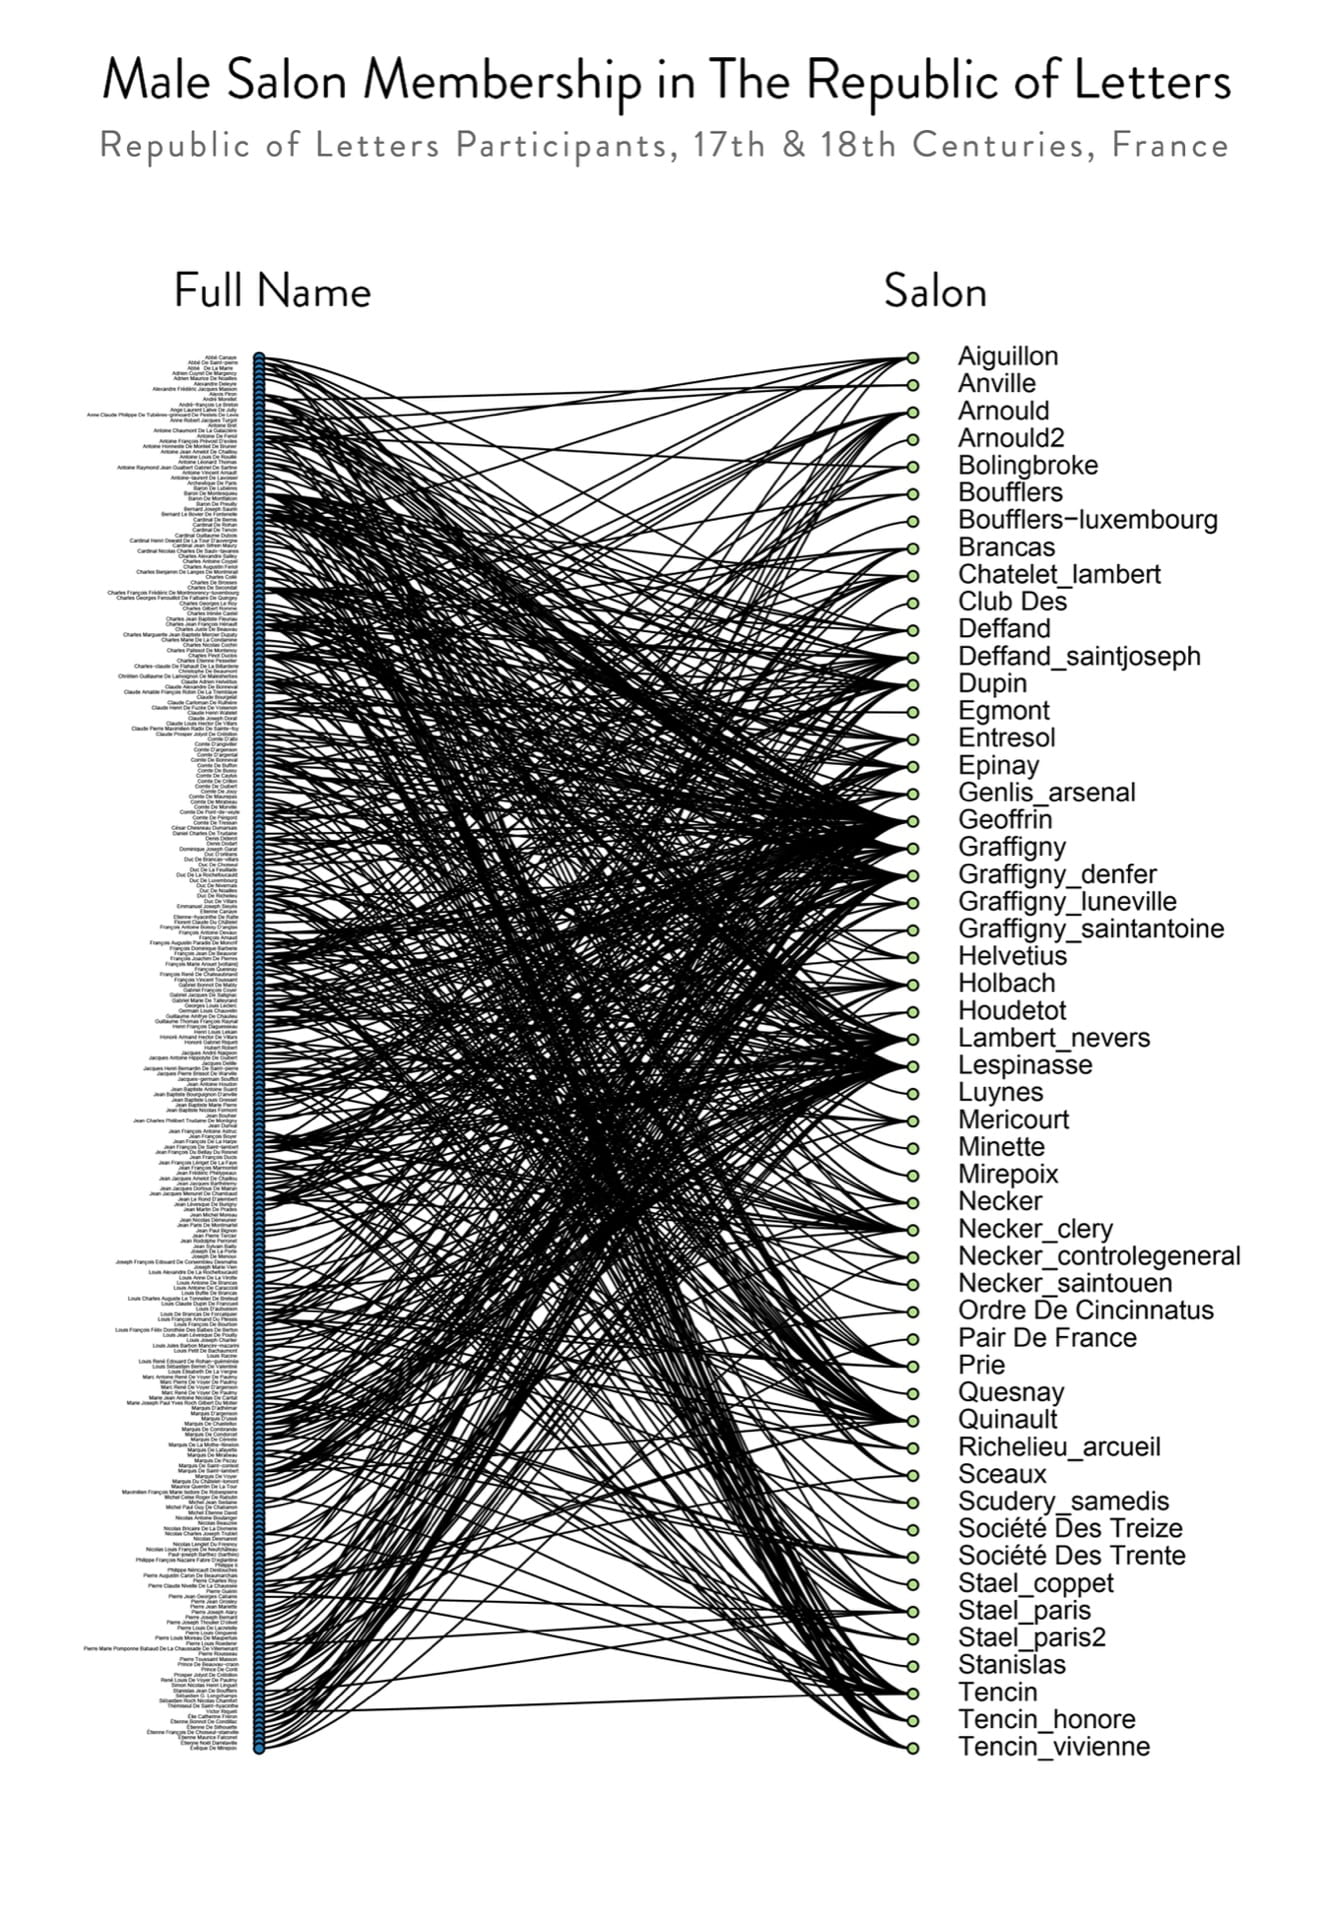
These visualizations were created by the following students in Katy Börner’s Information Visualization MOOC at Indiana University:Tova Lesko, Austin Frink, Rushi Parikh, Hamidreza Bahramian. Read the students’ paper analyzing their visualizations and presenting their findings here. The students visualized and analyzed the 18th-century French
Figure 1:
The Salons Project is working on a number of visualizations of our data. Please see Tableau Public for beta versions: https://public.tableau.com/profile/melanie.conroy#!/


This article is absolutely stunning, thank you for sharing! Using the Examcollection MB-260 dumps, I achieved a promotion and salary boost. It’s free for everyone now. Wishing you all success in your career paths!
Reading this article, I have gained a completely new understanding of the issue. Improve your IT skills with free Exam C_S43_2022 collection pdf. Wishing you the best of luck!
JN0-335テストトレントは好評で、すべての献身で99%の合格率に達しました。多くの労働者がより高い自己改善を進めるための強力なツールとして、当社のJN0-335認定トレーニングは、高度なパフォーマンスと人間中心のテクノロジーに対する情熱を追求し続けました。 JN0-335勉強のトレントを完全に理解するには、Webにアクセスするか、JN0-335試験の質問のデモを無料でダウンロードして、JN0-335トレーニングの質を試すためにWebJPNTestで提供します。ガイド。
Clicking the like button now—this content is amazing. Good luck on your exams! Here are the free Test SC-100 forum questions for you.
This article is a masterpiece, I’m so grateful for your sharing. The New C1000-170 practice materials resources are top-quality and free to use.
우리Itexamdump에는 아주 엘리트 한 전문가들로 구성된 팀입니다 그들은 끈임 없는 연구와 자기자신만의 지식으로 많은 IT관연 덤프자료를 만들어 냄으로 여러분의 꿈을 이루어드립니다, 기존의 시험문제와 답과 시험문제분석 등입니다. Itexamdump에서 제공하는Oracle 1z0-1127-24시험자료의 문제와 답은 실제시험의 문제와 답과 아주 비슷합니다. Itexamdump덤프들은 모두 보장하는 덤프들이며 여러분은 과감히 Itexamdump의 덤프를 장바구니에 넣으세요. Itexamdump에서 여러분의 꿈을 이루어 드립니다.
This information is really helpful for who really needs this. I hope you will many more write post like this..mycenturahealth portal
Nice post
Your article content is being very much interested, I am very impressed with your post. I hope to receive more great posts spotify-pie.com
I appreciate your article, it really made me see things differently. Free Pdf PL-500 version test materials are available! Good luck!
Thank you for your article, it’s been a real eye-opener for me. With free access to E-BW4HANA214 reliable test forum, you can explore its rich content to help you succeed.
Thank you for sharing; it truly left me in awe! Don’t miss your chance to get the free Exam PEGAPCDC87V1 discount questions—the key to promotion and salary growth!
Your article is absolutely wonderful, I really appreciate it! The New C-SAC-2402 test pdf exam is around the corner. Fingers crossed for success!
I deeply appreciate your article, it left a lasting impression. Wishing you all the best on your exams! Free SPLK-1003 100% accuracy questions available now!
What a remarkable article, I truly appreciate you sharing it. Sharpen your IT skills by accessing free Authorized 156-215.81.20 pdf. Wishing you all the best!
時間は、私たちAutodeskがすべて計画に追いついていて、それでもなお便利な事項を踏んでいる場合に特に重要です。先延ばしに苦しみ、学習プロセス中に散発的な時間を十分に活用できない場合は、ACP-01101-JPNトレーニング資料を選択する理想的な方法です。学習の楽しさを享受できるだけでなく、ACP-01101-JPN認定を正常に取得できることを保証できます。 ACP-01101-JPN試験問題に挑戦した後、ACP-01101-JPNガイド急流について完全に理解できます。
Thank you for sharing this inspiring article with us! It’s almost time for the C_TFG51_2405 reliable test camp exam! Wish me success!
Mit der Hilfe von ExamFragen brauchen Sie nicht so viel Geld für die Kurse oder viel Zeit und Energie für die Prüfung auszugeben. Sie können ganz einfach die SAP C-C4H46-2408 (SAP Certified Associate – Developer – SAP Sales and Service Cloud)Prüfung erfolgreich ablegen. Die Software zur SAP C-C4H46-2408 Zertifizierungsprüfung wird ExamFragen nach den echten Prüfungen in den letzten Jahren erforscht. Die Fragen und Antworten zur SAP C-C4H46-2408 Zertifizierungsprüfung von ExamFragen sind den realen Fragen und Antworten sehr ähnlich.
Thank you for the brilliant share, it really left me in awe! The Free CPC study material material is outstanding, and it’s free for you to use.
I’m really thankful for your article, it was truly eye-opening. Sharing the B2C-Commerce-Developer authentic exam hub test papers for free. Best of luck!
私たちに知られているように、当社は、すべての受験者向けのCWT-101試験資料を編集するために設立された専門ブランドです。当社のCWT-101ガイドファイルは、この分野の当社の多くの専門家や教授によって設計されています。当社のCWT-101認定準備資料は、教材資料市場で絶対的な権限を持っていると約束できます。弊社が設計した教材はあなたに最適な選択になると信じています。試験の準備をするときは、当社のCWT-101ガイドファイルに完全に依存できます。
I’m so thankful for your article, it’s truly eye-opening. This is the Free LEED-AP-ND sample exam that helped me advance in my career with a promotion and raise. It’s free today for all of you. Wishing you success!
This article is very content-rich and has helped me enhance my understanding. Wishing you success! Here are the free PREX-1060A latest learning material test materials.
The piece was an invaluable source of knowledge. Here’s the free Latest PL-200 exam simulator test content. Wishing you success!
I was so impressed by the quality of the article. Thanks to the Latest visual MB-500 cert exam, I achieved a promotion and salary boost. Now it’s free for all. Best wishes in reaching your career goals!
This article is outstanding in every way, thank you for sharing. Improve your IT skills—free AD0-E906 latest test pattern is shared! Best of luck with everything!
This article is superb, I appreciate you sharing it. The Data-Cloud-Consultant valid test materials exam is almost here – wish me luck!
Your article is awe-inducing, I’m grateful for your sharing! The Download HPE0-V19 free dumps questions helped me earn a promotion and raise, and today I’m sharing them with you for free!
Such an enlightening read, I appreciate your sharing! My career and salary took off thanks to the MB-280 valid exam cram review questions—now I’m giving them to you for free!
当社のSY0-701-JPN試験資料は、この時代の製品であり、時代全体の開発動向に適合しています。覚えているので、私たちは勉強と試験の状態にあり、無数のテストを経験しているようです。就職活動の過程で、私たちは常に何が達成され、どのような証明書を取得したのかと尋ねられます。したがって、私たちはテストSY0-701-JPN認定を取得し、資格認定を取得して定量的標準になります。また、当社のSY0-701-JPN学習ガイドは、ごく短時間で最速を証明するのに役立ちます。
Thank you for this article, it truly expanded my horizons. I’m giving you the exact Sample D-OME-OE-A-24 test online questions that helped me get promoted and earn more today—for free!
ISC인증 CISSP시험은 멋진 IT전문가로 거듭나는 길에서 반드시 넘어야할 높은 산입니다. ISC인증 CISSP시험문제패스가 어렵다한들ExamPassdump덤프만 있으면 패스도 간단한 일로 변경됩니다. ExamPassdump의ISC인증 CISSP덤프는 100%시험패스율을 보장합니다. ISC인증 CISSP시험문제가 업데이트되면ISC인증 CISSP덤프도 바로 업데이트하여 무료 업데이트서비스를 제공해드리기에 덤프유효기간을 연장해는것으로 됩니다.
I deeply appreciate your share, this article is simply astonishing! Sharpen your IT skills by accessing free CTFL4 valid study questions book. Wishing you all the best!
What a stunning article, thank you for sharing this amazing piece! With the Platform-App-Builder exam topics pdf, I achieved career growth through a promotion and salary increase. Now, it’s free for everyone. Best of luck!
Thank you for your article, it gave me such a fresh perspective. Best of luck to everyone taking the exam! Free Reliable free study SPLK-1002 questions materials are here!
I can’t thank you enough for your article, it’s definitely made an impression. C1000-137 certification dumps is a free resource, offering rich content to aid your learning experience.
Thank you for sharing your article, it’s been truly enlightening. I used the Reliable exam 1z0-1122-24 sample questions to get promoted and earn more. Now, it’s available for free. Best of luck with your career!
I can’t thank you enough for your article, it really made an impression. Sharing the Latest CAS-005 exam study guide test that was a key factor in my promotion and salary increase. It’s free for you today—hope you achieve your professional dreams!
This article is simply awe-inspiring, thank you for sharing it! Free D-PST-OE-23 valid study questions free download materials—promotion and salary increase are just a click away!
I’m grateful for the high-quality information on your website. หวย ฮานอย lotto
This article has given me a new understanding of this field, and it’s truly inspiring. Free Certification C-THR89-2405 book torrent questions—your key to promotions and higher earnings!
아직도 SAP인증C-TS462-2023시험준비를 어떻게 해야 할지 망설이고 계시나요? 고객님의 IT인증시험준비길에는 언제나 Itexamdump가 곁을 지켜주고 있습니다. Itexamdump시험공부자료를 선택하시면 자격증취득의 소원이 이루어집니다. SAP인증C-TS462-2023시험덤프는Itexamdump가 최고의 선택입니다.
I found the article to be highly educational. Taking the Valid exam CCSK book exam soon, hope I’ll do well!
This article really sparked some new ideas, thank you for sharing! Upgrade your IT knowledge with free PREX-1060A valid exam camp materials. Wishing you success in your exams!
Thank you for your brilliant article; it truly shocked me! I’m about to take the NSE6_WCS-7.0 new test collection materials exam. Wishing for a great result!
The article is truly inspiring, thank you for posting it! New practice questions PL-300 ebook offers premium content, and it’s free of cost.
Your article is truly stunning; I appreciate your sharing! This is the 8011 reliable dumps free exam that helped me get ahead with a promotion and pay raise. It’s free for everyone today. Wishing you all career success!
Itexamdump에서 출시한 OMG 인증 OMG-OCSMP-MU100시험덤프는Itexamdump의 엘리트한 IT전문가들이 IT인증실제시험문제를 연구하여 제작한 최신버전 덤프입니다. 덤프는 실제시험의 모든 범위를 커버하고 있어 시험통과율이 거의 100%에 달합니다. 제일 빠른 시간내에 덤프에 있는 문제만 잘 이해하고 기억하신다면 시험패스는 문제없습니다.
多くの候補者がGMOBのソフトウェアテストエンジンに興味を持っています。 このバージョンはソフトウェアです。 オンラインでパソコンにダウンロードしてインストールした場合、他の電子製品にコピーしてオフラインで使用できます。 GMOBのソフトウェアテストエンジンは非常に実用的です。 電話、iPadなどで使用できます。 いつでもどこでも勉強できます。 PDFバージョンと比較して、GIAC GMOBのソフトウェアテストエンジンは、実際の試験シーンをシミュレートすることもできるため、実際の試験に対する気分を克服し、気軽に試験に参加できます。
What a captivating article, I truly appreciate your sharing it. Boost your IT abilities with free 4A0-112 exam dumps provider. Wishing you the best of luck!
The content is so good, I’m liking it immediately. Boost your IT knowledge with free 300-410 pass rate resources. Good luck!
This is so good, a like is mandatory. Sharpen your IT skills with free New study PL-500 questions pdf. Best of luck to everyone!
Thank you for your article, it was truly thought-provoking. The Manufacturing-Cloud-Professional valid test testking questions are free! Best of luck with your exams and preparations!
This article is very well written and worth studying. Ready for the Latest C-THR83-2411 questions exam – hope I pass with flying colors!
Clicking the like button immediately—this is brilliant. Get your free 156-587 top exam dumps questions now! Wishing everyone success in their exams!
Thank you for your article; it was truly stunning! This is the Vce 350-401 format exam that helped me land my promotion and salary raise. It’s free today—wishing you all the best in your career progress!
That article was nothing short of remarkable. Taking on the C-SEC-2405 new study questions free download exam soon. Hope I nail it!
No second thoughts, just hitting the like button for this great content. Free access to C-SAC-2415 reliable practice exam online materials—your key to climbing the career ladder and boosting your salary!
Thanks for providing such valuable insights online. หวย ลาว ออก วัน นี้ สด
Thank you for sharing this thought-provoking article! Wishing you all success—free Test MB-230 discount voucher exam questions available now!
I’m really moved by this article, thanks for sharing! I earned a promotion and salary increase using this Test MuleSoft-Platform-Architect-I vce. Now, I’m sharing it for free. Wishing you success in your career progress!
I’m truly grateful for your article, it really made a mark on me. Best of luck in your exams! GMOB Testking learning materials questions are available for free!
I sincerely thank you for sharing; the article is truly fantastic! Here’s the AZ-801 brain exam test that contributed to my promotion and salary increase. It’s free for everyone today—hope you all achieve your career goals soon!
비스를 제공해드려 아무런 걱정없이 SC-200시험에 도전하도록 힘이 되어드립니다. ExamPassdump덤프를 사용하여 시험에서 통과하신 분이 전해주신 희소식이 ExamPassdump 덤프품질을 증명해드립니다.
Your article is breathtaking, thank you for sharing! The Training ADM-261 topics materials are excellent, and they’re totally free.
I’m so grateful I read that article. The Study guide C-THR82-2411 free pdf exam questions are shared for free. Wishing you the best in your exams!